Functions | |
| def | plotColor (nLines=1, index=0, nSpaghetti=None) |
| def | plotLineStyle (nLines=1, index=0, nSpaghetti=None) |
| def | setup_fig (nx=1, ny=1, inch_width=1.5, aspect=1.0, ybuffer=True) |
| def | finalize_fig (fig, filename='temporary_figure', filetype='png', ybuffer=True, xbuffer=False) |
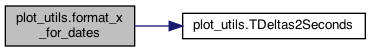
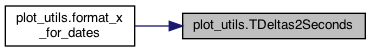
| def | TDeltas2Seconds (x_) |
| def | timeDeltaTicks (x, pos) |
| def | format_x_for_dates (ax, x) |
| def | get_clean_ax_limits (xmin_=np.NaN, xmax_=np.NaN, plotVals=[np.NaN], signdef=False, symmetric=True) |
| def | uniqueMembers (listVar) |
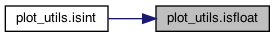
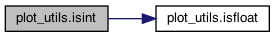
| def | isfloat (value) |
| def | isint (value) |
Variables | |
| list | colorIterator = ['k','b','g','r','c','m'] |
| list | styleIterator = ['-','--','-.',':'] |
| list | defaultPColors = colorIterator*len(styleIterator) |
| list | defaultPLineStyles = [] |
| list | plotSpecs |
| list | plotMarkers |
| DTimeLocator = AutoDateLocator() | |
| DTimeFormatter = ConciseDateFormatter(DTimeLocator) | |
| TDeltaFormatter = matplotlib.ticker.FuncFormatter(timeDeltaTicks) | |
Function Documentation
◆ finalize_fig()
| def plot_utils.finalize_fig | ( | fig, | |
filename = 'temporary_figure', |
|||
filetype = 'png', |
|||
ybuffer = True, |
|||
xbuffer = False |
|||
| ) |
Definition at line 79 of file plot_utils.py.
◆ format_x_for_dates()
| def plot_utils.format_x_for_dates | ( | ax, | |
| x | |||
| ) |
◆ get_clean_ax_limits()
| def plot_utils.get_clean_ax_limits | ( | xmin_ = np.NaN, |
|
xmax_ = np.NaN, |
|||
plotVals = [np.NaN], |
|||
signdef = False, |
|||
symmetric = True |
|||
| ) |
Definition at line 193 of file plot_utils.py.
◆ isfloat()
| def plot_utils.isfloat | ( | value | ) |
◆ isint()
| def plot_utils.isint | ( | value | ) |
◆ plotColor()
| def plot_utils.plotColor | ( | nLines = 1, |
|
index = 0, |
|||
nSpaghetti = None |
|||
| ) |
Definition at line 33 of file plot_utils.py.
◆ plotLineStyle()
| def plot_utils.plotLineStyle | ( | nLines = 1, |
|
index = 0, |
|||
nSpaghetti = None |
|||
| ) |
Definition at line 42 of file plot_utils.py.
◆ setup_fig()
| def plot_utils.setup_fig | ( | nx = 1, |
|
ny = 1, |
|||
inch_width = 1.5, |
|||
aspect = 1.0, |
|||
ybuffer = True |
|||
| ) |
Definition at line 58 of file plot_utils.py.
◆ TDeltas2Seconds()
| def plot_utils.TDeltas2Seconds | ( | x_ | ) |
◆ timeDeltaTicks()
| def plot_utils.timeDeltaTicks | ( | x, | |
| pos | |||
| ) |
Definition at line 114 of file plot_utils.py.
◆ uniqueMembers()
| def plot_utils.uniqueMembers | ( | listVar | ) |
Definition at line 230 of file plot_utils.py.
Variable Documentation
◆ colorIterator
| list plot_utils.colorIterator = ['k','b','g','r','c','m'] |
Definition at line 17 of file plot_utils.py.
◆ defaultPColors
| list plot_utils.defaultPColors = colorIterator*len(styleIterator) |
Definition at line 22 of file plot_utils.py.
◆ defaultPLineStyles
| list plot_utils.defaultPLineStyles = [] |
Definition at line 23 of file plot_utils.py.
◆ DTimeFormatter
| plot_utils.DTimeFormatter = ConciseDateFormatter(DTimeLocator) |
Definition at line 165 of file plot_utils.py.
◆ DTimeLocator
| plot_utils.DTimeLocator = AutoDateLocator() |
Definition at line 164 of file plot_utils.py.
◆ plotMarkers
| list plot_utils.plotMarkers |
Initial value:
Definition at line 53 of file plot_utils.py.
◆ plotSpecs
| list plot_utils.plotSpecs |
Initial value:
Definition at line 51 of file plot_utils.py.
◆ styleIterator
| list plot_utils.styleIterator = ['-','--','-.',':'] |
Definition at line 19 of file plot_utils.py.
◆ TDeltaFormatter
| plot_utils.TDeltaFormatter = matplotlib.ticker.FuncFormatter(timeDeltaTicks) |
Definition at line 166 of file plot_utils.py.