Functions | |
| def | plotDistri (lats, lons, values, ObsType, VarName, var_unit, out_name, nstation, levbin, dmin=None, dmax=None, dotsize=6, color="rainbow") |
| def | scatterMapFields (lons, lats, fields, filename, minLon=-180., maxLon=180., minLat=-90., maxLat=90., cLon=None, projection='default', dmin=None, dmax=None, markers={}, sizes={}, cmap='gist_ncar', cbarType=None, c={}, logVLim=1.e-12) |
| def | plotTimeserial2D (Stats, xlabeltime, ylevels, VarName) |
| def | plotSeries (fig, linesVals, xVals, linesLabel, title="", dataLabel="y", sciticks=False, logscale=False, signdef=False, indepLabel="x", invert_ind_axis=False, ny=1, nx=1, nplots=1, iplot=0, linesValsMinCI=None, linesValsMaxCI=None, dmin=np.NaN, dmax=np.NaN, lineAttribOffset=0, legend_inside=True, interiorLabels=True) |
| def | plotProfile (fig, linesVals, yVals, linesLabel, title="", dataLabel="x", sciticks=False, logscale=False, signdef=False, indepLabel="y", invert_ind_axis=False, ny=1, nx=1, nplots=1, iplot=0, linesValsMinCI=None, linesValsMaxCI=None, dmin=np.NaN, dmax=np.NaN, lineAttribOffset=0, legend_inside=True, interiorLabels=True) |
| def | plotTimeSeries (fig, xsDates, linesVals, linesLabel, title="", dataLabel="", sciticks=False, logscale=False, signdef=False, ny=1, nx=1, nplots=1, iplot=0, linesValsMinCI=None, linesValsMaxCI=None, dmin=np.NaN, dmax=np.NaN, lineAttribOffset=0, legend_inside=True, interiorLabels=True) |
| def | plotTimeSeries2D (fig, xDates, yVals, contourVals, title="", clabel="", sciticks=False, logscale=False, signdef=False, dataLabel="y", invert_ind_axis=False, ny=1, nx=1, nplots=1, iplot=0, dmin=np.NaN, dmax=np.NaN, interiorLabels=True) |
| def | transformXY_for_pcolor (xs, ys) |
| def | plotPDF (fig, countsVals, xVals, countsLabel, title="", indepLabel="x", ny=1, nx=1, nplots=1, iplot=0, lineAttribOffset=1, legend_inside=True, interiorLabels=True) |
| def | plotfitRampComposite (fig, xVals, countVals, meanVals, rmsVals, stdVals, title="", dataLabel="y", indepLabel="x", ny=1, nx=1, nplots=1, iplot=0, lineAttribOffset=1, legend_inside=True, interiorLabels=True) |
Variables | |
| _logger = logging.getLogger(__name__) | |
| cmGray = plt.cm.get_cmap("gist_gray") | |
| cmRainbow = plt.cm.get_cmap("gist_rainbow") | |
| cmSpectral = plt.cm.get_cmap("nipy_spectral") | |
| cmHeat = plt.cm.get_cmap("gist_heat") | |
| cmOcean = plt.cm.get_cmap("ocean") | |
| cmNCAR = plt.cm.get_cmap("gist_ncar") | |
| WhiteBlack1 = cmGray(np.linspace(1.0,0.0,17)) | |
| BlackRed = cmHeat(np.linspace(0.0,0.5,10)) | |
| ROYG = cmSpectral(np.linspace(0.9,0.43,27)) | |
| GreenBlueCyan = cmNCAR(np.linspace(0.05,0.2,20)) | |
| MVW = cmNCAR(np.linspace(0.8,0.98,21)) | |
| WhiteBlack2 = cmGray(np.linspace(0.9,0.0,31)) | |
| btcolors = np.concatenate((WhiteBlack1, BlackRed, ROYG, GreenBlueCyan, MVW, WhiteBlack2)) | |
| btCMap = colors.ListedColormap(btcolors) | |
| dictionary | distriZooms = {} |
| int | maxLegendEntries = 12 |
| int | lenWarnSer = 0 |
| int | nanWarnSer = 0 |
| int | lenWarnProf = 0 |
| int | nanWarnProf = 0 |
| int | lenWarnTS = 0 |
| int | nanWarnTS = 0 |
| int | lenWarnPDF = 0 |
| int | nanWarnPDF = 0 |
| int | lenWarnRamp = 0 |
| int | nanWarnRamp = 0 |
Function Documentation
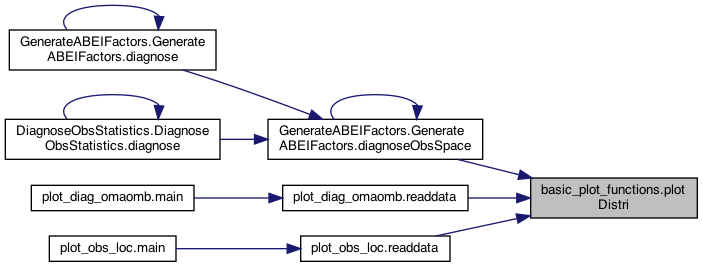
◆ plotDistri()
| def basic_plot_functions.plotDistri | ( | lats, | |
| lons, | |||
| values, | |||
| ObsType, | |||
| VarName, | |||
| var_unit, | |||
| out_name, | |||
| nstation, | |||
| levbin, | |||
dmin = None, |
|||
dmax = None, |
|||
dotsize = 6, |
|||
color = "rainbow" |
|||
| ) |
◆ plotfitRampComposite()
| def basic_plot_functions.plotfitRampComposite | ( | fig, | |
| xVals, | |||
| countVals, | |||
| meanVals, | |||
| rmsVals, | |||
| stdVals, | |||
title = "", |
|||
dataLabel = "y", |
|||
indepLabel = "x", |
|||
ny = 1, |
|||
nx = 1, |
|||
nplots = 1, |
|||
iplot = 0, |
|||
lineAttribOffset = 1, |
|||
legend_inside = True, |
|||
interiorLabels = True |
|||
| ) |
Definition at line 1319 of file basic_plot_functions.py.
◆ plotPDF()
| def basic_plot_functions.plotPDF | ( | fig, | |
| countsVals, | |||
| xVals, | |||
| countsLabel, | |||
title = "", |
|||
indepLabel = "x", |
|||
ny = 1, |
|||
nx = 1, |
|||
nplots = 1, |
|||
iplot = 0, |
|||
lineAttribOffset = 1, |
|||
legend_inside = True, |
|||
interiorLabels = True |
|||
| ) |
Definition at line 1206 of file basic_plot_functions.py.
◆ plotProfile()
| def basic_plot_functions.plotProfile | ( | fig, | |
| linesVals, | |||
| yVals, | |||
| linesLabel, | |||
title = "", |
|||
dataLabel = "x", |
|||
sciticks = False, |
|||
logscale = False, |
|||
signdef = False, |
|||
indepLabel = "y", |
|||
invert_ind_axis = False, |
|||
ny = 1, |
|||
nx = 1, |
|||
nplots = 1, |
|||
iplot = 0, |
|||
linesValsMinCI = None, |
|||
linesValsMaxCI = None, |
|||
dmin = np.NaN, |
|||
dmax = np.NaN, |
|||
lineAttribOffset = 0, |
|||
legend_inside = True, |
|||
interiorLabels = True |
|||
| ) |
Definition at line 617 of file basic_plot_functions.py.
◆ plotSeries()
| def basic_plot_functions.plotSeries | ( | fig, | |
| linesVals, | |||
| xVals, | |||
| linesLabel, | |||
title = "", |
|||
dataLabel = "y", |
|||
sciticks = False, |
|||
logscale = False, |
|||
signdef = False, |
|||
indepLabel = "x", |
|||
invert_ind_axis = False, |
|||
ny = 1, |
|||
nx = 1, |
|||
nplots = 1, |
|||
iplot = 0, |
|||
linesValsMinCI = None, |
|||
linesValsMaxCI = None, |
|||
dmin = np.NaN, |
|||
dmax = np.NaN, |
|||
lineAttribOffset = 0, |
|||
legend_inside = True, |
|||
interiorLabels = True |
|||
| ) |
Definition at line 408 of file basic_plot_functions.py.
◆ plotTimeserial2D()
| def basic_plot_functions.plotTimeserial2D | ( | Stats, | |
| xlabeltime, | |||
| ylevels, | |||
| VarName | |||
| ) |
Definition at line 331 of file basic_plot_functions.py.
◆ plotTimeSeries()
| def basic_plot_functions.plotTimeSeries | ( | fig, | |
| xsDates, | |||
| linesVals, | |||
| linesLabel, | |||
title = "", |
|||
dataLabel = "", |
|||
sciticks = False, |
|||
logscale = False, |
|||
signdef = False, |
|||
ny = 1, |
|||
nx = 1, |
|||
nplots = 1, |
|||
iplot = 0, |
|||
linesValsMinCI = None, |
|||
linesValsMaxCI = None, |
|||
dmin = np.NaN, |
|||
dmax = np.NaN, |
|||
lineAttribOffset = 0, |
|||
legend_inside = True, |
|||
interiorLabels = True |
|||
| ) |
Definition at line 828 of file basic_plot_functions.py.
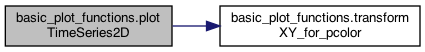
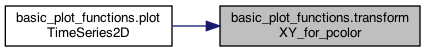
◆ plotTimeSeries2D()
| def basic_plot_functions.plotTimeSeries2D | ( | fig, | |
| xDates, | |||
| yVals, | |||
| contourVals, | |||
title = "", |
|||
clabel = "", |
|||
sciticks = False, |
|||
logscale = False, |
|||
signdef = False, |
|||
dataLabel = "y", |
|||
invert_ind_axis = False, |
|||
ny = 1, |
|||
nx = 1, |
|||
nplots = 1, |
|||
iplot = 0, |
|||
dmin = np.NaN, |
|||
dmax = np.NaN, |
|||
interiorLabels = True |
|||
| ) |
◆ scatterMapFields()
| def basic_plot_functions.scatterMapFields | ( | lons, | |
| lats, | |||
| fields, | |||
| filename, | |||
minLon = -180., |
|||
maxLon = 180., |
|||
minLat = -90., |
|||
maxLat = 90., |
|||
cLon = None, |
|||
projection = 'default', |
|||
dmin = None, |
|||
dmax = None, |
|||
markers = {}, |
|||
sizes = {}, |
|||
cmap = 'gist_ncar', |
|||
cbarType = None, |
|||
c = {}, |
|||
logVLim = 1.e-12 |
|||
| ) |
Definition at line 218 of file basic_plot_functions.py.
◆ transformXY_for_pcolor()
| def basic_plot_functions.transformXY_for_pcolor | ( | xs, | |
| ys | |||
| ) |
Definition at line 1171 of file basic_plot_functions.py.
Variable Documentation
◆ _logger
|
private |
Definition at line 22 of file basic_plot_functions.py.
◆ BlackRed
| basic_plot_functions.BlackRed = cmHeat(np.linspace(0.0,0.5,10)) |
Definition at line 32 of file basic_plot_functions.py.
◆ btCMap
| basic_plot_functions.btCMap = colors.ListedColormap(btcolors) |
Definition at line 45 of file basic_plot_functions.py.
◆ btcolors
| basic_plot_functions.btcolors = np.concatenate((WhiteBlack1, BlackRed, ROYG, GreenBlueCyan, MVW, WhiteBlack2)) |
Definition at line 43 of file basic_plot_functions.py.
◆ cmGray
| basic_plot_functions.cmGray = plt.cm.get_cmap("gist_gray") |
Definition at line 24 of file basic_plot_functions.py.
◆ cmHeat
| basic_plot_functions.cmHeat = plt.cm.get_cmap("gist_heat") |
Definition at line 27 of file basic_plot_functions.py.
◆ cmNCAR
| basic_plot_functions.cmNCAR = plt.cm.get_cmap("gist_ncar") |
Definition at line 29 of file basic_plot_functions.py.
◆ cmOcean
| basic_plot_functions.cmOcean = plt.cm.get_cmap("ocean") |
Definition at line 28 of file basic_plot_functions.py.
◆ cmRainbow
| basic_plot_functions.cmRainbow = plt.cm.get_cmap("gist_rainbow") |
Definition at line 25 of file basic_plot_functions.py.
◆ cmSpectral
| basic_plot_functions.cmSpectral = plt.cm.get_cmap("nipy_spectral") |
Definition at line 26 of file basic_plot_functions.py.
◆ distriZooms
| dictionary basic_plot_functions.distriZooms = {} |
Definition at line 49 of file basic_plot_functions.py.
◆ GreenBlueCyan
| basic_plot_functions.GreenBlueCyan = cmNCAR(np.linspace(0.05,0.2,20)) |
Definition at line 36 of file basic_plot_functions.py.
◆ lenWarnPDF
| int basic_plot_functions.lenWarnPDF = 0 |
Definition at line 1204 of file basic_plot_functions.py.
◆ lenWarnProf
| int basic_plot_functions.lenWarnProf = 0 |
Definition at line 615 of file basic_plot_functions.py.
◆ lenWarnRamp
| int basic_plot_functions.lenWarnRamp = 0 |
Definition at line 1317 of file basic_plot_functions.py.
◆ lenWarnSer
| int basic_plot_functions.lenWarnSer = 0 |
Definition at line 406 of file basic_plot_functions.py.
◆ lenWarnTS
| int basic_plot_functions.lenWarnTS = 0 |
Definition at line 826 of file basic_plot_functions.py.
◆ maxLegendEntries
| int basic_plot_functions.maxLegendEntries = 12 |
Definition at line 403 of file basic_plot_functions.py.
◆ MVW
| basic_plot_functions.MVW = cmNCAR(np.linspace(0.8,0.98,21)) |
Definition at line 38 of file basic_plot_functions.py.
◆ nanWarnPDF
| int basic_plot_functions.nanWarnPDF = 0 |
Definition at line 1205 of file basic_plot_functions.py.
◆ nanWarnProf
| int basic_plot_functions.nanWarnProf = 0 |
Definition at line 616 of file basic_plot_functions.py.
◆ nanWarnRamp
| int basic_plot_functions.nanWarnRamp = 0 |
Definition at line 1318 of file basic_plot_functions.py.
◆ nanWarnSer
| int basic_plot_functions.nanWarnSer = 0 |
Definition at line 407 of file basic_plot_functions.py.
◆ nanWarnTS
| int basic_plot_functions.nanWarnTS = 0 |
Definition at line 827 of file basic_plot_functions.py.
◆ ROYG
| basic_plot_functions.ROYG = cmSpectral(np.linspace(0.9,0.43,27)) |
Definition at line 33 of file basic_plot_functions.py.
◆ WhiteBlack1
| basic_plot_functions.WhiteBlack1 = cmGray(np.linspace(1.0,0.0,17)) |
Definition at line 31 of file basic_plot_functions.py.
◆ WhiteBlack2
| basic_plot_functions.WhiteBlack2 = cmGray(np.linspace(0.9,0.0,31)) |
Definition at line 39 of file basic_plot_functions.py.